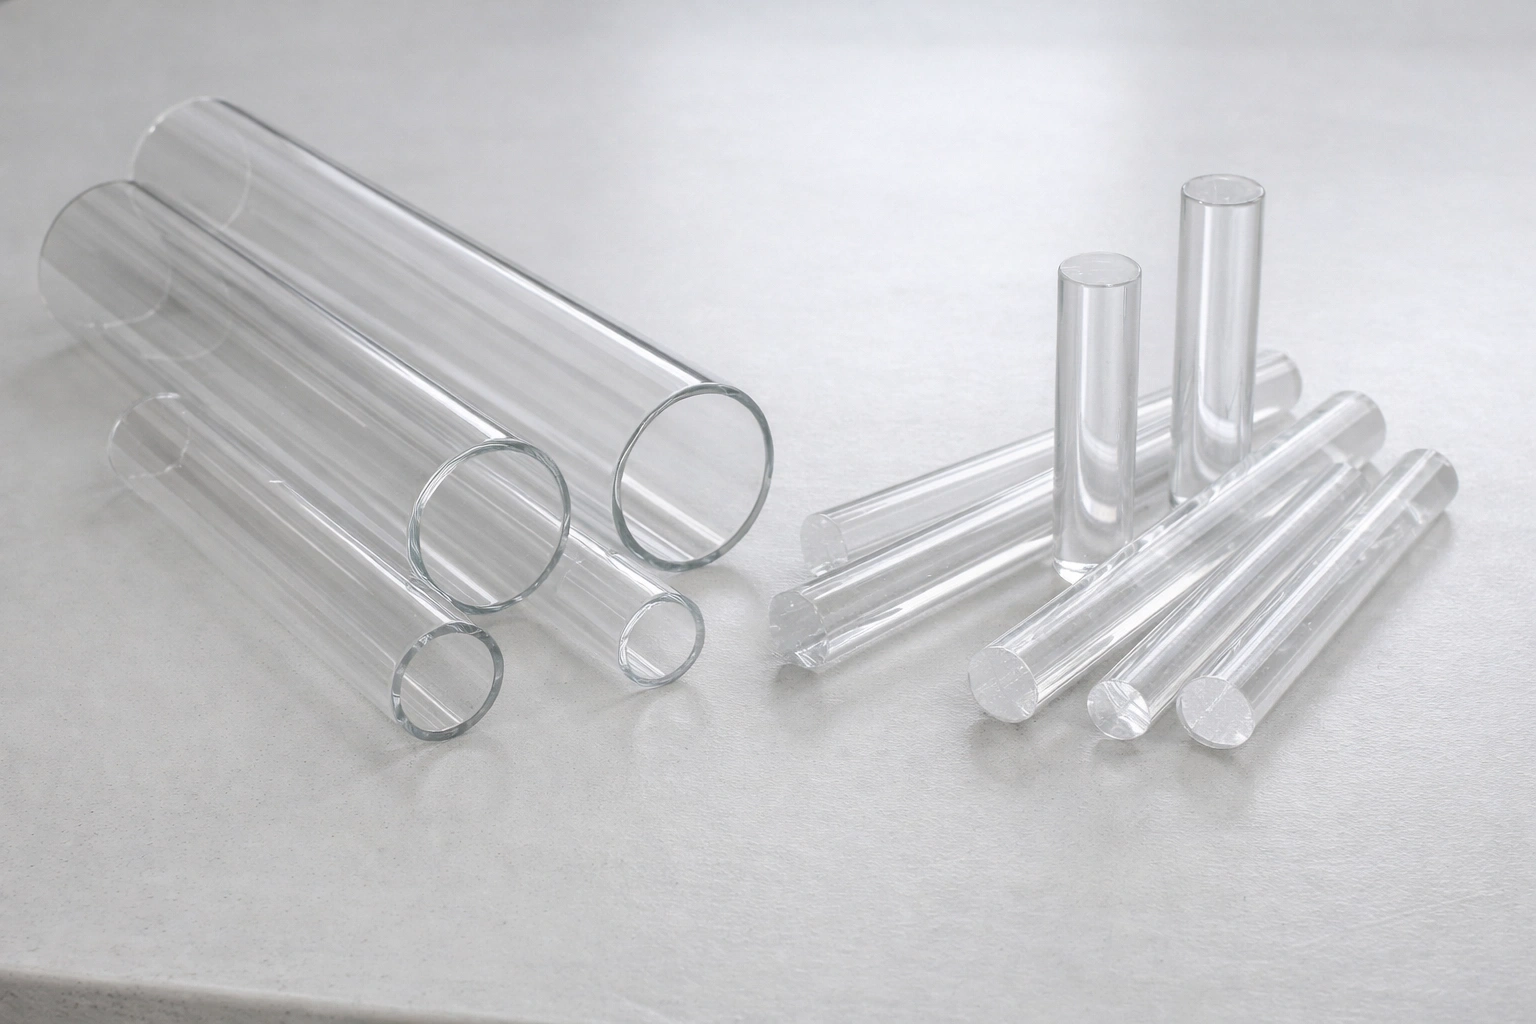
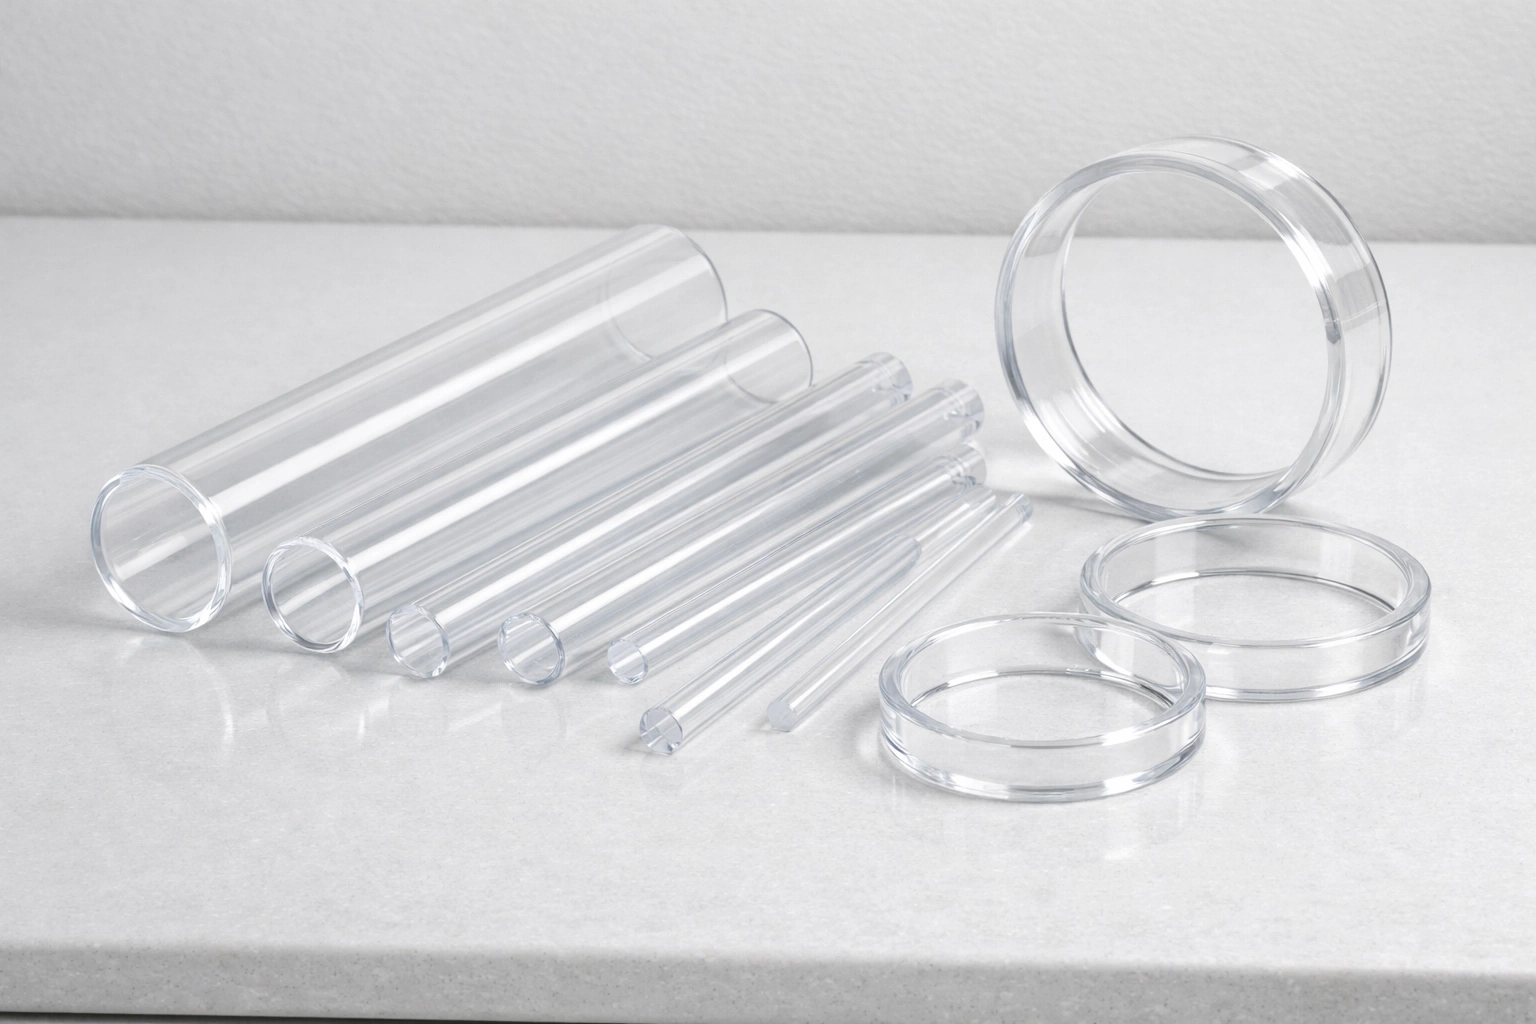
High-performance laboratory quartz plates must meet strict surface quality requirements that determine their suitability for advanced applications. Each laboratory relies on precise quartz plate surface quality laboratory specifications to ensure reliable results in demanding environments. The most common uses span sample containment, analytical instrumentation, and high-temperature reactions across pharmaceutical, biotechnology, and chemical industries.
Application Type | Industries Involved |
|---|---|
Sample Containment | Pharmaceutical, Biotechnology |
Analytical Instrumentation | Pharmaceutical, Biotechnology, Chemical |
High-Temperature Reactions | Chemical |
Key Takeaways
Surface quality is crucial for laboratory quartz plates, impacting performance in applications like spectroscopy and chemical analysis.
For deep UV spectroscopy, quartz plates must have a surface roughness (Ra) below 10 nm to minimize light scattering and enhance measurement sensitivity.
ISO standards, such as ISO 4287 and ISO 25178, provide essential guidelines for measuring surface texture, ensuring consistency and reliability across suppliers.
Proper scratch-dig specifications prevent performance degradation in chemical applications, extending the lifespan of quartz plates in aggressive environments.
Quality managers should implement strict verification protocols and validate supplier certificates to ensure compliance with surface quality standards.
What Surface Roughness Specifications Are Critical for Deep UV Spectroscopy (<250 nm)?

Surface roughness plays a decisive role in the performance of quartz plates used for deep UV spectroscopy below 250 nm. Laboratories must specify and verify the correct surface quality to minimize light scattering and achieve reliable, high-sensitivity measurements. This section explains how roughness, polishing, and measurement standards define the quartz plate surface quality laboratory specifications essential for advanced UV applications.
How Does Rayleigh Scattering Scale with Surface Roughness and Wavelength
Rayleigh scattering increases sharply as surface roughness rises and as the wavelength of light decreases. The intensity of scattered light depends on the square of the root-mean-square (rms) height of the surface roughness, making even small imperfections critical at deep UV wavelengths. For deep UV spectroscopy, excessive scattering from rough surfaces can reduce transmission by up to 8% at 220 nm, directly impacting detection limits and signal-to-noise ratios.
Key Points:
Scattering loss (SSL) is proportional to the square of surface roughness (αSSL∝hrms²).
At wavelengths below 250 nm, roughness-induced scattering becomes the dominant source of signal loss.
Lowering surface roughness directly improves analytical sensitivity in UV applications.
The relationship between roughness and wavelength means that quartz plate surface quality laboratory specifications must set strict limits for deep UV use. Laboratories that require detection of low-concentration analytes must prioritize surfaces with Ra values below 10 nm to control Rayleigh scattering.
What Polishing Processes Achieve Ra <10 nm Optical Finishes
Achieving an Ra value below 10 nm on quartz plates requires advanced polishing techniques. Manufacturers use ultra-fine abrasives and tightly controlled polishing environments to reach this level of smoothness. Some facilities also apply plasma etching, which further reduces surface roughness by removing microscopic peaks and valleys.
Ultra-fine abrasives remove surface irregularities at the nanometer scale.
Controlled polishing conditions prevent contamination and ensure uniformity.
Plasma etching can lower roughness beyond what mechanical polishing achieves.
These processes form the foundation of quartz plate surface quality laboratory specifications for deep UV spectroscopy. Laboratories that demand the highest optical performance should confirm that their suppliers use these advanced finishing methods.
Understanding ISO 4287 and ISO 25178 Surface Texture Measurement Standards
ISO 4287 and ISO 25178 provide the international framework for measuring and certifying surface texture on laboratory quartz plates. ISO 4287 defines 2D profile parameters such as Ra (arithmetic mean deviation), Rz (maximum height), and Rv (maximum valley depth), which are essential for evaluating surface quality. ISO 25178 expands this approach to 3D surface texture, offering a more comprehensive assessment of the plate’s topography.
Standard | Focus | Key Parameters | Impact on Quality |
|---|---|---|---|
ISO 4287 | 2D Profile | Ra, Rz, Rv | Sets baseline for roughness acceptance |
ISO 25178 | 3D Texture | Sa, Sz, Sv | Enables full-surface evaluation |
These standards ensure that quartz plate surface quality laboratory specifications remain consistent and verifiable across suppliers. Laboratories should require certification to these standards to guarantee that plates meet the necessary criteria for deep UV performance.
What Scratch-Dig Specifications Prevent Performance Degradation in Chemical Applications?
Scratch-dig specifications play a critical role in maintaining the chemical durability of laboratory quartz plates. Chemical applications often expose plates to aggressive environments, where even minor surface defects can accelerate failure. Selecting the right scratch-dig level ensures long service life and reliable performance in demanding laboratory settings.
How Do Stress Concentration Factors Accelerate Chemical Dissolution
Surface scratches and digs act as stress concentrators, making quartz plates more vulnerable to chemical attack. When acids or bases contact these defects, dissolution rates increase dramatically at the defect site. This process leads to localized material loss and can shorten the service life of the plate.
The pits in the polished quartz surfaces form at the locations where the grains from the matrix are in contact with the quartz crystal plates, indicating that material has been removed by dissolution rather than pushed aside after progressive brittle deformation.
Because no evidence was found for pit development by fracturing and because plastic deformation of quartz can be ruled out at these relatively low PT conditions, it is inferred that the pits seen in QC13 and QC14 were formed by stress and/or strain-induced solution transfer (i.e. IPS) from the contact points between polished crystal facets and quartz grains.
A summary table highlights the relationship between defect size and performance:
Parameter | Threshold | Performance Impact |
|---|---|---|
Scratch Depth | <20 μm | Stable clarity |
Dig Diameter | <0.3 mm | Low scatter |
Scatter Rate | <2% | Accurate imaging |
What Inspection Protocols Verify MIL-PRF-13830B Compliance
Laboratories rely on standardized inspection protocols to verify that quartz plates meet MIL-PRF-13830B scratch-dig requirements. Inspectors use controlled lighting and direct comparison to reference standards to evaluate surface defects. Automated inspection systems help reduce subjectivity and ensure consistent results.
Key steps in MIL-PRF-13830B inspection:
Visual inspection under controlled lighting for scratches and digs.
Measurement of dig diameter, considering both axes if elliptical.
Automated systems provide consistent lighting and minimize human error.
Plates must not exceed the maximum allowable scratch width or dig diameter for their specified grade. For example, a 40-20 scratch-dig specification limits scratches to 0.4 mm wide and digs to 0.2 mm in diameter, which preserves chemical resistance.
Scratch Number | Max. Scratch Width (mm) | Dig Number | Max. Dig Diameter (mm) |
|---|---|---|---|
40 | 0.04 | 20 | 0.2 |
60 | 0.06 | 40 | 0.4 |
Understanding Capillary Action in Surface Defect Corrosion Mechanisms
Capillary action in surface defects accelerates chemical corrosion by drawing aggressive solutions deep into scratches and digs. This effect traps corrosive agents, increasing the rate of localized attack. Over time, these channels can propagate through the plate, causing premature failure.
QC13 and QC14 were conducted at similar temperature (350 °C), similar applied effective pressure (a few tens of MPa) and similar duration (two months). Despite the difference stress application (axial loading in oedometer vs hydrostatic loading) and different surface morphology of the quartz sand, IPS was observed in both tests.
A chart illustrates how scratch and dig numbers relate to maximum defect size:

Summary of key points:
Capillary action increases chemical exposure at defect sites.
Deeper or wider defects accelerate localized corrosion.
Proper quartz plate surface quality laboratory specifications minimize these risks.
Careful selection and inspection of scratch-dig levels protect quartz plates in chemical environments and extend their operational lifespan.
What Flatness Tolerances Are Required for Quantitative Spectroscopic Measurements?
Flatness tolerances directly impact the accuracy of quantitative spectroscopic measurements. Laboratories depend on precise quartz plate surfaces to maintain consistent optical path lengths and minimize measurement errors. This section explains how flatness affects beam geometry, the methods used to verify flatness, and the standards required for pharmaceutical analysis.
How Do Wedge Angles from Non-Flat Surfaces Affect Beam Geometry
Non-flat quartz plates introduce wedge angles that distort the path of light beams during spectroscopic measurements. These wedge angles cause the transmitted beam to deviate, leading to inconsistent optical path lengths and systematic absorbance errors. Even small deviations from flatness can result in significant measurement inaccuracies, especially in multi-point or high-throughput screening.
Wedge effects become more pronounced as the flatness tolerance loosens. For example, a λ/4 flatness can introduce up to 0.8% absorbance error, which exceeds the analytical uncertainty limits for pharmaceutical quality control. Laboratories that require precise quantification must specify higher flatness tolerances, such as λ/10, to ensure reliable results.
Summary of key impacts:
Wedge angles distort beam geometry and reduce measurement accuracy.
Tighter flatness tolerances (λ/10) minimize systematic errors.
Consistent flatness supports reproducible quantitative analysis.
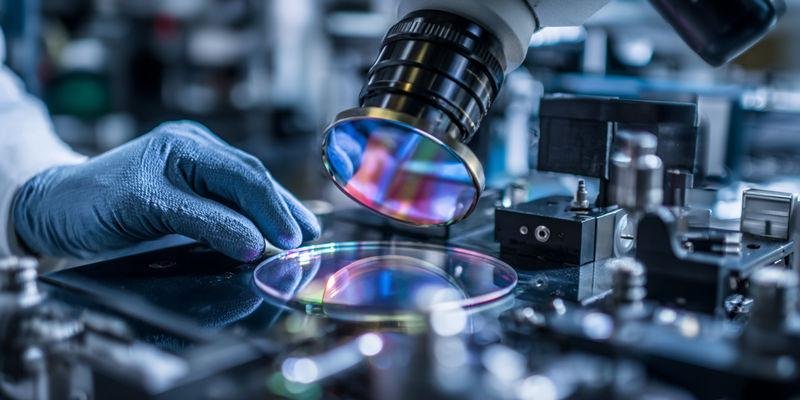
What Interferometric Testing Validates λ/10 Flatness Specifications
Interferometric testing provides the most reliable method for validating λ/10 flatness in laboratory quartz plates. Fizeau interferometers use a collimated light source to create interference patterns that reveal surface deviations with nanometer precision. Monochromatic light ensures clear and coherent patterns, while non-contact measurement preserves the integrity of the plate surface.
Laboratories prefer interferometric testing because it delivers objective, high-resolution data. This method allows users to detect even minor deviations from the specified flatness, ensuring that only plates meeting strict criteria enter critical applications. Non-contact techniques also prevent accidental surface damage during inspection.
Method | Description |
|---|---|
Fizeau Interferometer | Uses collimated light to analyze interference patterns for flatness measurement. |
Monochromatic Light | Provides coherent waves for clear pattern formation. |
Non-Contact Measurement | Maintains plate integrity by avoiding physical contact. |
Understanding USP <857> Optical Path Requirements for Pharmaceutical Analysis
USP <857> sets strict requirements for optical path consistency in pharmaceutical spectroscopic analysis. The standard limits total analytical uncertainty to ±2%, making flatness a critical parameter for compliance. Laboratories must ensure that quartz plate surface quality laboratory specifications align with these requirements to avoid systematic errors.
A λ/10 flatness specification supports path length consistency across the measurement beam, reducing coefficient of variation in multi-point assays. This level of flatness enables detection of small concentration differences, which is essential for pharmaceutical quality control and regulatory compliance. Visual inspection, profilometry, and interferometry each play a role in verifying flatness, with interferometry reserved for the most demanding applications.
Inspection Method | When to Use | Strength |
|---|---|---|
Visual | Routine incoming checks | Quick, low-cost screening |
Profilometry | Analytical-grade purchases | Quantitative surface mapping |
Interferometry | Precision/critical analysis | Nanometer-scale accuracy |
What Surface Cleanliness Standards Prevent Contamination in Trace Analysis?

Surface cleanliness standards play a vital role in preventing contamination during trace analysis. Laboratories must control particulate and molecular residues to achieve reliable detection limits and avoid analytical artifacts. This section outlines how contamination affects results, which standards apply, and why water purity is essential for final cleaning.
How Does Surface Contamination Introduce Trace Analysis Artifacts
Surface contamination can introduce significant artifacts in trace analysis by releasing unwanted particles or residues into samples. Even small amounts of organic or metallic contamination may elevate detection limits, masking true analyte concentrations. Laboratories often observe false positives or elevated baselines when surface residues exceed critical thresholds.
Contaminants such as polishing compounds, atmospheric particulates, and skin oils can interfere with fluorescence intensity and elemental analysis. These substances may alter calibration curves, reduce dynamic range, and compromise data plausibility. Improved cleaning and preparation methods, such as vapor phase decomposition, help lower detection limits and enhance accuracy.
Contamination control supports consistent calibration, reliable automation, and high up-time in laboratory operations.
Summary Table: Impact of Surface Contamination on Trace Analysis
Feature | Description |
|---|---|
Calibration | One-point calibration affected by residues |
Dynamic Range | Reduced by surface contamination |
Fluorescence Intensity | Altered by organic and metallic particles |
Preparation | Enhanced by advanced cleaning methods |
What ISO 14644-1 Cleanroom Standards Apply to Laboratory Glassware
ISO 14644-1 sets the benchmark for cleanroom standards in laboratory glassware preparation. Laboratories must meet strict particle count limits to minimize contamination risks in trace analysis. Class 5 cleanroom environments restrict particles larger than 0.5 µm to fewer than 3,520 per cubic meter, ensuring surfaces remain free from interfering residues.
Cleanroom protocols include controlled air filtration, specialized clothing, and regular monitoring of particulate levels. These measures help maintain the integrity of quartz plate surface quality laboratory specifications for sensitive applications. Facilities that follow ISO 14644-1 standards consistently achieve lower contamination rates and improved analytical reliability.
Key Points:
Class 5 cleanrooms maintain ultra-low particle counts.
Strict protocols reduce contamination and analytical errors.
Compliance supports trace analysis at ppb and ppt levels.
Understanding Deionized Water Purity Requirements for Final Cleaning
Deionized water purity is essential for the final cleaning of quartz plates used in trace analysis. Laboratories select Type I water with resistivity approaching 18.2 MΩ·cm and total organic carbon below 10 ppb to eliminate residual contaminants. Minimal microbial presence ensures that cleaning does not introduce new sources of interference.
Type I water provides the highest level of purity, while Type II water offers adequate performance for less sensitive applications. Facilities use water with conductivity below 0.056 µS/cm for critical cleaning steps, supporting the removal of both ionic and organic residues.
Summary of Recommended Water Purity Levels:
Type I water: Resistivity ~18.2 MΩ·cm, TOC <10 ppb, bacteria <0.1 CFU/mL
Type II water: Resistivity >1.0 MΩ·cm
Conductivity for cleaning: <0.056 µS/cm
Surface Quality Hierarchy and Decision Matrix for Laboratory Needs
Laboratories match surface cleanliness standards to application requirements using a five-level hierarchy.
Surface Quality Levels:
Critical Optical: Deep UV spectroscopy, laser optics
Optical Precision: UV-Vis quantitative analysis, pharmaceutical QC
Analytical Grade: Chemical resistance, trace analysis
Standard Laboratory: Routine spectroscopy, general chemical use
Industrial Grade: Furnace windows, mechanical protection
A simple decision matrix helps select the most cost-effective specification:
Application Requirement | Recommended Surface Quality Level |
|---|---|
Detection limits <1 ppb | Critical Optical / Cleanroom Class 5 |
Routine analysis (ppm-ppb) | Analytical Grade / Standard Laboratory |
Mechanical or thermal use | Industrial Grade |
Selecting the appropriate cleanliness standard ensures reliable results and avoids unnecessary costs.
What Industrial-Grade Surface Standards Are Acceptable for Non-Critical Applications?
Industrial-grade quartz plates offer a practical solution for laboratories where optical precision is not essential. These standards balance cost and durability, making them ideal for furnace windows, containment vessels, and mechanical substrates. Understanding the specifications and trade-offs helps laboratories optimize performance without overspending.
What Cost-Benefit Analysis Justifies Optical vs Industrial Grade Selection
Laboratories often face decisions between optical-grade and industrial-grade quartz plates. Optical-grade surfaces require advanced polishing and strict inspection, resulting in higher costs and longer lead times. Industrial-grade plates meet essential durability and purity requirements at a fraction of the price.
Cost savings become significant when surface quality exceeds application needs. For example, industrial-grade quartz plates with ≥99.98% SiO₂ purity and flatness ≤0.02mm per 100mm provide reliable performance for non-critical tasks. Laboratories can allocate resources more efficiently by matching surface standards to actual requirements.
Key points for cost-benefit analysis:
Industrial-grade plates reduce procurement costs by up to 50%.
Optical-grade finishes are only necessary for high-precision optical or analytical work.
Material purity and flatness in industrial-grade plates meet most mechanical and thermal needs.
How to Categorize Applications by Surface Quality Criticality
Categorizing laboratory applications by surface quality criticality ensures the right quartz plate is selected for each task. Laboratories use criteria such as grade, flatness tolerance, material, and thermal stability to determine the appropriate standard. Grade 0 suits inspection rooms, while Grade 2 fits general shop work.
Flatness tolerance and material purity influence measurement accuracy and durability. Applications requiring precise measurements demand tighter tolerances, while containment or thermal protection can accept broader specifications. Thermal stability also plays a role in environments with fluctuating temperatures.
Criteria | Description |
|---|---|
Grade | Grade 0: Highest accuracy; Grade 1: General inspection; Grade 2: Shop work |
Flatness Tolerance | Critical for precise measurements |
Material | Impacts durability and resistance |
Thermal Stability | Maintains accuracy in temperature changes |
Understanding Performance Trade-offs Across Surface Specification Levels
Selecting industrial-grade quartz plates involves understanding performance trade-offs. Lower surface quality may increase light scattering or reduce chemical resistance, but these effects remain negligible in non-critical applications. Laboratories must weigh the benefits of cost savings against the potential impact on performance.
Industrial-grade standards provide sufficient material purity and flatness for most mechanical and thermal uses. The trade-off comes in reduced optical clarity and higher surface roughness, which do not affect applications outside spectroscopy or trace analysis. Laboratories benefit from specifying only what is necessary for the intended use.
Summary of performance trade-offs:
Industrial-grade plates offer durability and cost efficiency.
Optical-grade plates deliver superior clarity and precision.
Application-driven selection maximizes value and reliability.
How Should Quality Managers Implement Surface Quality Verification Protocols?
Quality managers play a vital role in ensuring laboratory quartz plates meet strict surface quality standards. Effective verification protocols protect laboratory results from costly errors and maintain compliance with industry requirements. This section outlines practical strategies for equipment investment and certificate validation to support reliable procurement decisions.
What Equipment Investment Matches Inspection to Purchase Volume
Quality managers must select inspection equipment that aligns with their laboratory’s purchase volume and application needs. Facilities with high throughput benefit from investing in advanced surface plates and profilometers, which provide precise reference planes and detailed surface measurements. Smaller laboratories can achieve cost savings by sourcing used surface plates from reputable sellers, balancing quality with budget constraints.
Surface plates serve as the foundation for accurate inspection, minimizing errors and enhancing efficiency in quality control processes. Profilometers and interferometers add value by enabling nanometer-scale surface analysis, which is essential for optical-grade applications. The price of inspection equipment varies by brand, model, and condition, so managers should evaluate options carefully to maximize return on investment.
Key considerations for equipment investment:
Used surface plates offer significant savings without sacrificing performance.
Reputable suppliers ensure reliable quality and long-term value.
Matching equipment capability to purchase volume optimizes inspection efficiency.
How to Interpret and Validate Supplier-Provided Surface Quality Certificates
Quality managers must interpret supplier-provided surface quality certificates with a critical eye. Certificates should reference recognized standards such as ISO 4287 for roughness, MIL-PRF-13830B for scratch-dig, and ISO 10110-5 for flatness, ensuring traceability and consistency. Managers should verify that certificates include batch-specific data, not just generic statements, to confirm compliance with laboratory requirements.
A thorough review of certificates helps identify discrepancies between supplier claims and actual product quality. Facilities that implement formal inspection protocols report non-conformance rates of 12–18% when verifying optical-grade specifications, highlighting the importance of independent validation. Managers should request supporting documentation, such as calibration records and test reports, to strengthen confidence in supplier data.
Certificate Feature | Why It Matters | What to Check |
|---|---|---|
Standard Referenced | Ensures traceability | ISO/MIL/ASTM listed |
Batch-Specific Data | Confirms actual compliance | Serial numbers, test results |
Supporting Documents | Validates accuracy | Calibration, test reports |
Careful interpretation and validation of certificates safeguard laboratory investments and uphold analytical integrity.
Laboratories achieve reliable results by specifying the right surface quality for each application. Quartz plate surface quality laboratory specifications define performance in spectroscopy, chemical resistance, and trace analysis. Selecting the correct grade ensures both accuracy and cost-effectiveness. Laboratories should follow the outlined criteria and verification protocols when choosing quartz plates. Prioritizing application-matched surface quality supports better outcomes and efficient procurement.
FAQ
What surface roughness is recommended for deep UV spectroscopy?
Laboratories specify Ra <10 nm for deep UV spectroscopy. This level minimizes Rayleigh scattering and maximizes signal-to-noise ratio. Plates with higher roughness degrade detection limits.
Key points:
Ra <10 nm required for <250 nm UV
Lower roughness improves sensitivity
Verified by ISO 4287 standards
What does a 40-20 scratch-dig specification mean?
A 40-20 scratch-dig rating limits scratches to 0.4 mm wide and digs to 0.2 mm diameter. This specification protects quartz plates from accelerated chemical attack and ensures long service life.
Specification | Max Scratch Width | Max Dig Diameter |
|---|---|---|
40-20 | 0.4 mm | 0.2 mm |
What flatness tolerance supports quantitative spectroscopic measurements?
Laboratories require λ/10 flatness for quantitative spectroscopy. This tolerance keeps optical path length variation below 0.1%, supporting accurate absorbance readings and compliance with USP <857>.
Summary:
λ/10 flatness reduces measurement error
Ensures path length consistency
Validated by interferometric testing
What cleanliness standard prevents contamination in trace analysis?
ISO 14644-1 Class 5 cleanroom preparation ensures quartz plates remain free from interfering particles. This standard supports detection limits below 1 ppb and reliable trace analysis.
Cleanroom Class | Max Particle Count (>0.5 µm/m³) |
|---|---|
Class 5 | 3,520 |
What inspection methods verify surface quality specifications?
Quality managers use visual inspection, profilometry, and interferometry to verify surface quality. Each method matches a specific specification and application need.
Inspection methods:
Visual: scratch-dig
Profilometry: roughness
Interferometry: flatness