Quartz tube manufacturing UV clarity depends on the choice of process, material purity, and tube dimensions. Electrical fusion methods deliver the highest UV transmission rates, especially at deep UV wavelengths, due to low hydroxyl content and high synthetic silica purity. The following factors influence UV transmission:
Preparation process determines how much UV light passes through the tube.
Material purity supports consistent transmission rates.
Tube thickness and size change the amount of UV reaching the target.
Feature | Description |
|---|---|
Base Material | Synthetic quartz, SiO₂ ≥ 99.99%, low hydroxyl |
Cut-off Wavelength | UV below 280 nm often blocked in standard tubes |
Transmittance | ≥90% for visible, ≥85% for infrared |
Key Takeaways
Electrical fusion methods provide the best UV clarity due to low hydroxyl content and high purity.
Synthetic silica feedstock ensures higher UV transmission compared to natural quartz, making it ideal for sensitive applications.
Surface treatments like mechanical polishing and anti-reflection coatings significantly enhance UV transmission.
Choosing the right manufacturing method depends on the specific UV application and required clarity.
Regular quality control, including spectrophotometric testing, is essential to ensure consistent UV performance.
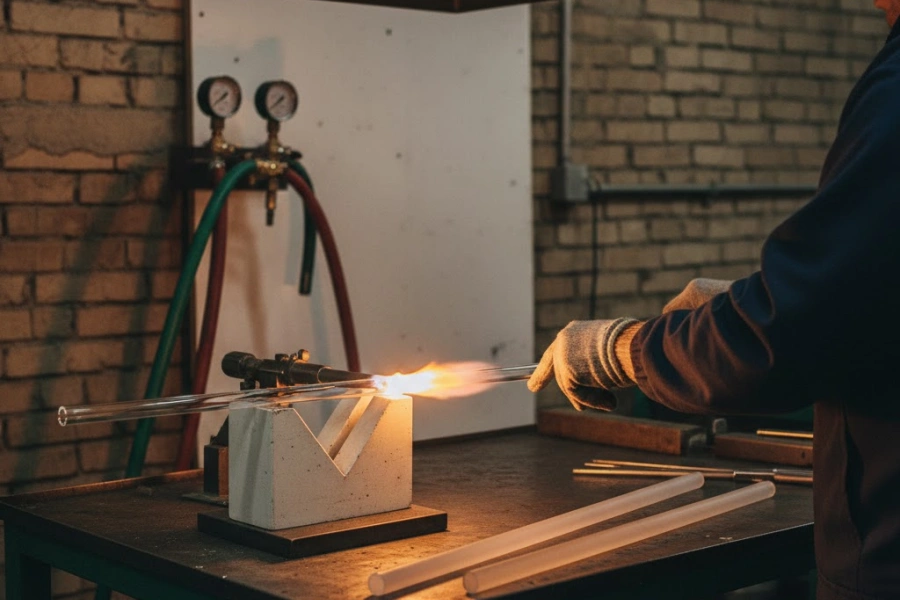
How Do Electrical Fusion and Flame Fusion Processes Differ in UV Performance?
Quartz tube manufacturing methods play a crucial role in determining UV clarity and transmission rates. Electrical fusion and flame fusion represent two primary processes, each with unique chemical and physical impacts on quartz tube performance. Understanding their differences helps users select the best method for their specific UV application needs.
Process Chemistry Fundamentals Affecting OH Incorporation
The process chemistry behind electrical fusion and flame fusion directly affects the amount of hydroxyl (OH) groups in quartz tubes. Electrical fusion uses resistive heating in a vacuum or inert atmosphere, which minimizes hydrogen incorporation and keeps OH levels low. Flame fusion relies on an oxyhydrogen flame, introducing water vapor and increasing OH content in the quartz structure.
Lower OH content in electrical fusion tubes leads to higher UV transmission, especially at deep UV wavelengths. Flame fusion tubes, with higher OH levels, show reduced transmission in the same range. The difference in OH content results from the presence or absence of water vapor during manufacturing.
The following table summarizes the typical OH content found in quartz tubes produced by each method, highlighting the direct impact of process chemistry on UV clarity:
Production Method | OH Content (ppm) |
|---|---|
Electrical Fusion | 150 |
Flame Fusion | 180 - 250 |
Wavelength-Specific Performance Trade-offs Between Fusion Methods
Electrical fusion tubes excel in deep UV applications due to their low OH content. These tubes maintain transmission rates above 82% at 200 nm, making them ideal for tasks like protein crystallography and UV fluorescence microscopy. Flame fusion tubes, while more cost-effective, perform better in the near-infrared range and provide adequate transmission for wavelengths above 250 nm.
Users must consider the working wavelength when choosing a manufacturing method. For applications below 220 nm, electrical fusion offers superior clarity and signal-to-noise ratios. For general laboratory work above 250 nm, flame fusion provides similar performance at a lower cost.
To help clarify these trade-offs, here is a bulleted summary of key points:
Electrical fusion delivers ≥82% transmission at 200 nm.
Flame fusion achieves ≥75% at 200 nm, but excels in the infrared.
Select electrical fusion for deep UV; choose flame fusion for UV-A and visible applications.
Manufacturing Cost and Quality Consistency Comparisons
Manufacturing cost and quality consistency differ significantly between electrical fusion and flame fusion processes. Electrical fusion requires advanced equipment and controlled environments, resulting in higher production costs but exceptional batch-to-batch purity. Flame fusion uses simpler setups, lowering costs and making it accessible for standard UV applications.
Electrical fusion achieves ≥99.98% purity consistency, with minimal variation between batches. Flame fusion, while cost-effective, shows slightly more variation in purity due to less controlled processing conditions. This consistency impacts the reliability of quartz tube manufacturing UV clarity for demanding applications.
The table below highlights the relationship between manufacturing method, cost, and quality consistency:
Method | Cost | Purity Consistency |
|---|---|---|
Electrical Fusion | Higher | ≥99.98% |
Flame Fusion | Lower | ±0.02% variation |
What Role Does Synthetic Silica Feedstock Play in UV Optical Quality?
Synthetic silica feedstock sets the standard for UV optical quality in quartz tube manufacturing. The purity and homogeneity of the feedstock directly influence transmission rates and minimize absorption losses. Manufacturers must consider both the source and processing technique to achieve optimal quartz tube manufacturing UV clarity.
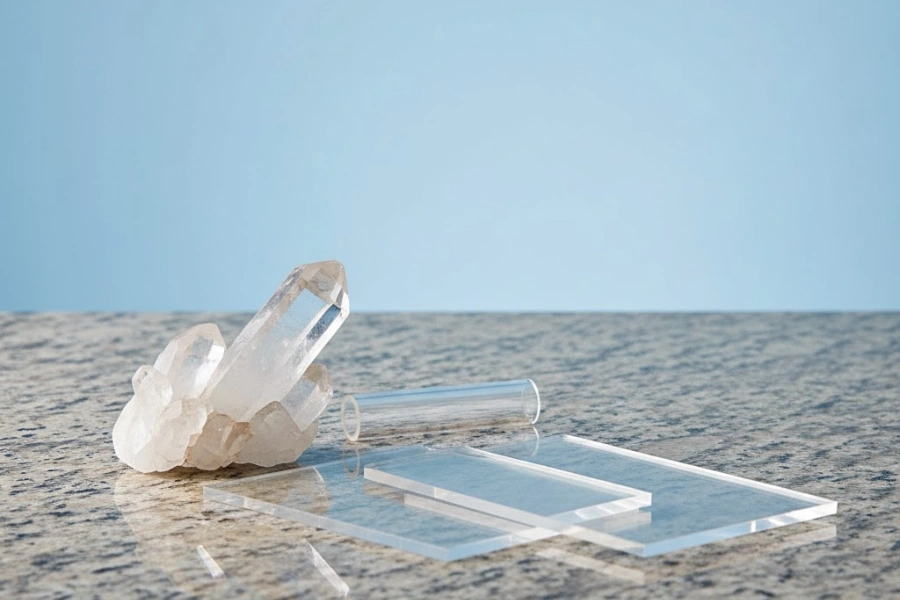
Synthetic vs. Natural Feedstock Purity Comparison
Synthetic silica feedstock contains fewer impurities than natural quartz, resulting in higher UV transmission. Manufacturers produce synthetic silica by oxidizing silicon tetrachloride in a controlled environment, which achieves purity levels of at least 99.99% SiO₂. Natural quartz, formed over long periods in the earth, often retains metallic impurities even after purification.
The difference in purity leads to significant performance gaps. Synthetic quartz glass transmits over 80% of deep UV light, while natural quartz may lose transmission due to residual contaminants. Homogeneous structure in synthetic silica further reduces absorption and scattering, making it the preferred choice for demanding UV applications.
The following table summarizes key purity and transmission differences:
Feedstock Type | Purity (SiO₂) | Metallic Impurities (ppm) | UV Transmission at 200 nm |
|---|---|---|---|
Synthetic | ≥99.99% | <10 | >80% |
Natural | 99.98% | 50-200 | <70% |
Impurity Profiles and UV Transmission Correlation
Impurity profiles in quartz tubes directly affect UV transmission. Metallic elements such as iron and aluminum absorb UV light, reducing clarity and efficiency. Synthetic silica minimizes these impurities, which supports consistent performance in UV-sensitive applications.
Manufacturers rely on impurity analysis to predict transmission rates. Data shows that tubes with less than 10 ppm total metallic impurities maintain high transmission, while those with higher impurity levels experience up to 12% loss at deep UV wavelengths. This correlation guides feedstock selection for applications requiring maximum clarity.
To highlight the main points, consider the following summary:
Low impurity levels ensure superior UV transmission.
Synthetic silica offers more consistent results than natural quartz.
Impurity analysis helps manufacturers optimize tube performance.
Cost-Benefit Analysis for Feedstock Selection
Cost plays a major role in feedstock selection for quartz tube manufacturing UV clarity. Synthetic silica costs 25-35% more than natural quartz due to advanced processing and purity control. However, the improved transmission and reduced absorption losses often justify the investment for deep UV applications.
Manufacturers must balance budget constraints with performance needs. For wavelengths above 250 nm, natural quartz provides adequate clarity at a lower price. When applications demand maximum transmission below 220 nm, synthetic silica becomes the cost-effective choice despite its premium.
The table below outlines the cost-benefit relationship:
Feedstock | Relative Cost | Recommended Use |
|---|---|---|
Synthetic | High | Deep UV, high-sensitivity tasks |
Natural | Low | General UV, budget applications |
Why Do Continuous Draw and Rotational Molding Techniques Affect Optical Uniformity?
Manufacturers use continuous draw and rotational molding techniques to shape quartz tubes for UV applications. Each method affects the tube’s optical uniformity and dimensional precision. Understanding these differences helps users select the right tube for their specific needs.
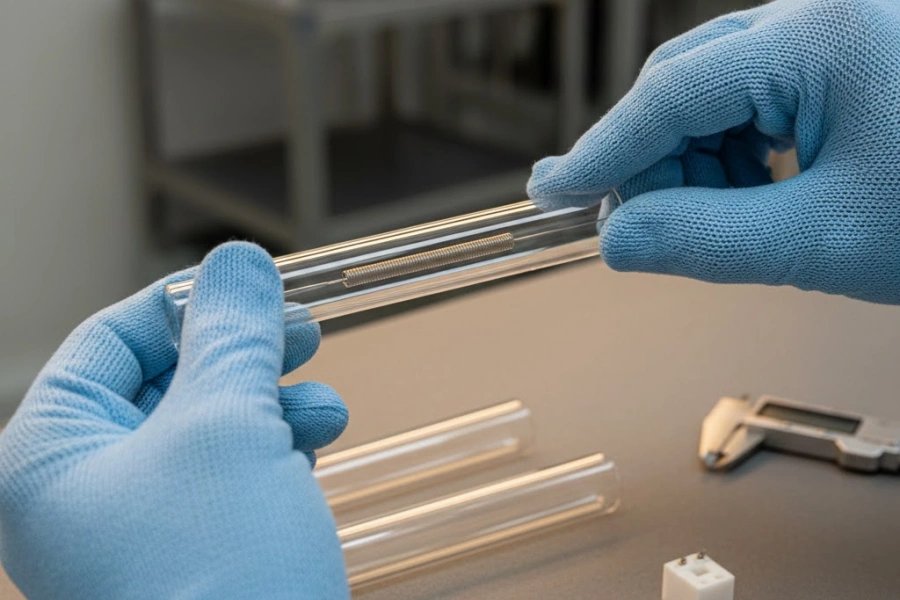
Manufacturing Process Effects on Dimensional Tolerance
Continuous draw manufacturing produces quartz tubes with tight dimensional tolerances. This method controls the flow of molten quartz through precision dies, resulting in wall thickness variation of only ±0.05mm. Rotational molding, which forms tubes by rotating preforms, often leads to greater thickness variation, sometimes reaching ±0.15mm.
Dimensional tolerance impacts how much UV light passes through the tube. Tubes with consistent wall thickness allow for predictable transmission rates, which is important for accurate measurements in spectroscopy. Continuous draw tubes also maintain a core/cladding ratio tolerance within ±1.5%, supporting specialty fiber applications.
The following table highlights the key differences in dimensional tolerance and their effects:
Manufacturing Method | Wall Thickness Tolerance | Impact on UV Transmission |
|---|---|---|
Continuous Draw | ±0.05mm | Consistent, predictable |
Rotational Molding | ±0.15mm | Variable, less reliable |
Optical Homogeneity Requirements for Precision Spectroscopy
Optical homogeneity ensures that quartz tubes transmit UV light evenly across their length. Continuous draw manufacturing achieves refractive index variation of less than 0.0003, which is crucial for maintaining consistent signal dispersion in spectroscopy. Rotational molding can introduce striae and localized index changes, reducing optical clarity.
Precision spectroscopy relies on tubes with uniform optical properties. Inconsistent refractive index can cause measurement errors and reduce the reliability of results. Enhanced quality control procedures in continuous draw manufacturing help preforms meet or exceed fiber specifications.
To summarize the main points, consider the following bulleted list:
Continuous draw achieves superior optical homogeneity.
Low refractive index variation supports accurate spectroscopy.
Quality control ensures tubes meet strict optical standards.
Application-Based Manufacturing Method Selection Criteria
Selecting the right manufacturing method depends on the application’s requirements. Continuous draw tubes work best for precision UV spectroscopy, where dimensional and optical uniformity are critical. Rotational molding suits large-diameter tubes used in high-temperature processing, where optical precision matters less.
Users should match the tube’s manufacturing method to their performance needs and budget. For applications demanding tight tolerances and high UV clarity, continuous draw offers the best results. Rotational molding provides a cost-effective solution for less demanding uses.
The following table presents key selection criteria:
Application Type | Recommended Method | Reason |
|---|---|---|
Precision Spectroscopy | Continuous Draw | Uniformity and accuracy |
Large-Diameter Processing | Rotational Molding | Cost and size flexibility |
What Surface Treatment Technologies Enhance UV Transmission Performance?
Surface treatments play a vital role in maximizing UV transmission through quartz tubes. Manufacturers use advanced polishing and coating methods to reduce scatter and improve clarity. Selecting the right surface technology ensures that quartz tube manufacturing UV clarity meets the demands of high-performance applications.
Surface Finish Impact on UV Scatter and Transmission
Surface finish determines how much UV light passes through a quartz tube without scattering. Polishing methods such as fire polishing and mechanical grinding remove microscopic roughness, which can cause light to scatter and reduce transmission. Data from TOQUARTZ shows that precision mechanical polishing to a 20-10 scratch-dig specification can improve transmission at 200 nm by 4-6% compared to untreated surfaces.
Manufacturers often choose mechanical polishing for demanding UV applications because it minimizes contamination and maintains dimensional accuracy. Fire polishing can create a smooth finish but may introduce surface contamination if not carefully controlled. Acid etching is sometimes used to further clean the surface, but it must be balanced with the risk of altering tube dimensions.
To summarize the main points, consider these key factors:
Polished surfaces reduce UV scatter and boost transmission.
Mechanical polishing offers the best balance of clarity and precision.
Surface contamination can lower transmission rates.
Anti-Reflection Coating Technologies for UV Wavelengths
Anti-reflection (AR) coatings enhance UV transmission by minimizing reflection losses at the quartz tube surface. Manufacturers apply AR coatings using ion-assisted evaporation or magnetron sputtering, which can raise transmission from 92% to over 99% per surface. These coatings are especially valuable for optical systems that require maximum photon efficiency.
Durability is a critical factor when selecting AR coatings for UV applications. Multi-layer coatings optimized for specific UV ranges, such as 200-400 nm, maintain high performance after extensive use. However, AR coatings add 40-80% to the tube price, so users must weigh the benefits against the cost for their application.
The following table highlights the impact of AR coatings on performance and cost:
Coating Type | Transmission Gain | Durability | Cost Increase |
|---|---|---|---|
Single-layer | 4-6% | Moderate | 40% |
Multi-layer | 6-8% | High | 80% |
Cost-Performance Analysis of Surface Enhancement Methods
Cost-performance analysis helps users decide which surface treatments provide the best value for their needs. Precision polishing and AR coatings deliver significant transmission improvements, but their cost varies depending on application requirements. For demanding UV tasks, the investment in surface enhancements often results in long-term value and improved measurement accuracy.
General UV applications may not require expensive treatments, as standard finishes provide adequate clarity. Manufacturers recommend matching the level of enhancement to the sensitivity and wavelength range of the intended use. Data shows that precision polishing improves transmission by up to 7%, while AR coatings add another 6-8%, making them ideal for high-sensitivity systems.
Here are the main considerations for cost-performance decisions:
Demanding UV applications justify higher investment in surface treatments.
General UV tasks can use standard finishes for cost savings.
Transmission gains from enhancements support better measurement accuracy.
Tip: Always request spectrophotometric testing, dimensional inspection, and impurity analysis from suppliers. Verifying actual transmission data at relevant wavelengths ensures consistent quality and optimal performance.
How Can Manufacturers Validate UV Clarity Through Production Quality Control?

Manufacturers must validate UV clarity at every stage of quartz tube production to ensure reliable performance in demanding applications. Effective quality control combines precise measurement, strict process monitoring, and clear decision frameworks. By following best practices, manufacturers can deliver quartz tubes that meet the highest standards for UV transmission and consistency.
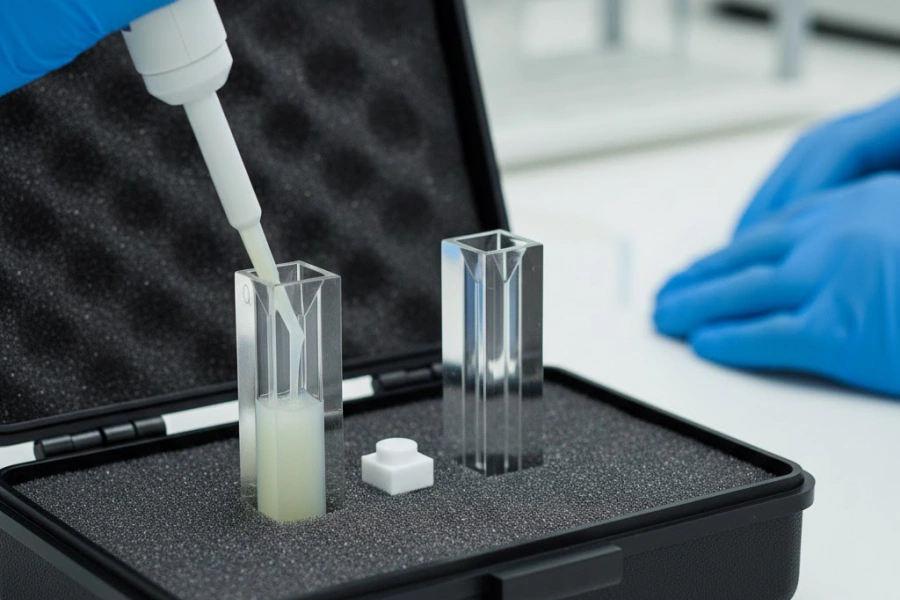
Spectrophotometric Testing Protocols for Production Monitoring
Spectrophotometric testing provides the foundation for monitoring UV clarity in quartz tube manufacturing. This method measures how much UV light passes through the tube at specific wavelengths, revealing any losses caused by impurities or surface defects. Manufacturers rely on these results to confirm that each batch meets the required transmission standards.
Operators prepare samples carefully to avoid contamination and ensure accurate readings. They standardize spectrophotometers regularly, which reduces drift errors and maintains measurement accuracy. Stable operating conditions, such as controlled temperature and humidity, further improve reliability and repeatability of results. Data from over 28,000 quality control measurements shows that real-time spectrophotometric monitoring increases first-pass yield to 98.5%, compared to 85% for periodic batch sampling.
To help manufacturers achieve consistent results, consider these best practices:
Prepare samples properly to prevent contamination.
Standardize devices regularly for accurate readings.
Maintain stable temperature and humidity during testing.
Manufacturers also use a decision framework to select the right production method based on application needs. The framework considers wavelength, purity, dimensional precision, and budget. For example, electrical fusion with synthetic feedstock suits deep UV applications below 220 nm, while flame fusion with natural feedstock fits standard UV tasks above 250 nm.
The following table summarizes key performance items that manufacturers monitor during spectrophotometric testing, highlighting their impact on quartz tube manufacturing UV clarity:
Performance Item | Description |
|---|---|
Wavelength accuracy | Measures how closely the detected peak matches the true value. |
Stray light | Refers to unwanted light that can distort measurements. |
Wavelength repeatability | Assesses consistency over multiple tests. |
Baseline stability | Evaluates the stability of the baseline signal. |
Photometric accuracy | Determines the accuracy of absorbance measurements. |
Baseline flatness | Checks the flatness of the baseline signal for accurate readings. |
Photometric repeatability | Tests the consistency of absorbance measurements across trials. |
Noise level | Measures the amount of noise in the signal. |
Resolution | Assesses the ability to distinguish between closely spaced wavelengths. |
Manufacturers should always request actual transmission data at relevant wavelengths from their suppliers. This practice ensures that the quartz tubes will perform as expected in their intended application. By verifying supplier quality and demanding real measurement data, users can confidently select the most cost-effective method that meets their requirements for quartz tube manufacturing UV clarity.
Quartz tube manufacturing methods and enhancements each offer unique benefits for UV clarity. Aligning the process, feedstock, and surface treatment with the application’s wavelength and purity needs ensures optimal results. The table below highlights which methods suit specific UV clarity requirements:
Method | Key Features | Suitability for UV Clarity |
|---|---|---|
Electrical Fusion | Low OH-content, high durability | High temperature UV applications |
Flame Fusion | Low bubble content | Plasma etch and general UV applications |
Synthetic Feedstock | Highest purity | Extreme UV, excimer lamp applications |
Electrical fusion works well for high temperature and durable UV uses.
Flame fusion provides excellent clarity where low bubble content matters.
Synthetic feedstock delivers the best results for extreme UV needs.
For best performance, users should always request actual transmission data at their target wavelengths and choose the most cost-effective method that meets their requirements.
FAQ
What factors most influence UV clarity in quartz tube manufacturing?
Quartz tube UV clarity depends on manufacturing method, feedstock purity, and surface treatment.
Electrical fusion reduces hydroxyl content.
Synthetic silica lowers metallic impurities.
Precision polishing improves transmission.
Data shows electrical fusion tubes achieve ≥82% transmission at 200 nm.
What is the difference between synthetic and natural quartz feedstock?
Synthetic quartz contains fewer impurities than natural quartz.
Manufacturers use vapor-phase oxidation for synthetic silica, achieving ≥99.99% purity.
Natural quartz often retains 50–200 ppm metallic impurities, which lowers deep UV transmission.
Feedstock Type | Purity (%) | Metallic Impurities (ppm) |
|---|---|---|
Synthetic | ≥99.99 | <10 |
Natural | 99.98 | 50–200 |
What surface treatments improve UV transmission in quartz tubes?
Surface treatments like mechanical polishing and anti-reflection coatings boost UV transmission.
Mechanical polishing reduces scatter by smoothing the surface.
Anti-reflection coatings increase transmission by 4–8% per surface, especially for deep UV applications.
Mechanical polishing: Best for clarity
AR coatings: Maximize photon efficiency
Fire polishing: Less precise, risk of contamination
What quality control methods validate UV clarity in production?
Manufacturers use spectrophotometric testing, dimensional inspection, and impurity analysis.
Real-time spectrophotometric monitoring increases first-pass yield to 98.5%.
Material certification includes XRF and ICP-MS analysis for purity and impurity profiles.
Method | Purpose |
|---|---|
Spectrophotometry | Measures transmission |
Dimensional Inspection | Checks tube thickness |
Impurity Analysis | Confirms purity levels |
What applications require the highest UV clarity in quartz tubes?
Deep UV spectroscopy, protein crystallography, and excimer lamp systems need maximum UV clarity.
These applications demand low hydroxyl content and ultra-high purity silica.
Electrical fusion with synthetic feedstock suits wavelengths below 220 nm.
For best results, users should request actual transmission data at their target wavelength.