Quartz cuvettes deliver exceptional UV performance — yet place one in a mid-IR beam and the spectrum collapses entirely. The explanation is rooted in atomic physics, not instrument failure.
Fused silica's Si-O bond network generates intense intrinsic absorption bands that fall squarely within the 400–4000 cm⁻¹ mid-infrared window. This article dissects every vibrational, electronic, and phonon mechanism responsible for that opacity, providing precise wavelength boundaries, quantified absorbance values, and a complete material comparison framework.
Understanding why quartz cuvette IR transmission fails in the mid-IR requires tracing the problem back to the silicon-oxygen bond itself — its polarity, its vibrational frequency, and its extraordinary absorptive power per unit thickness.
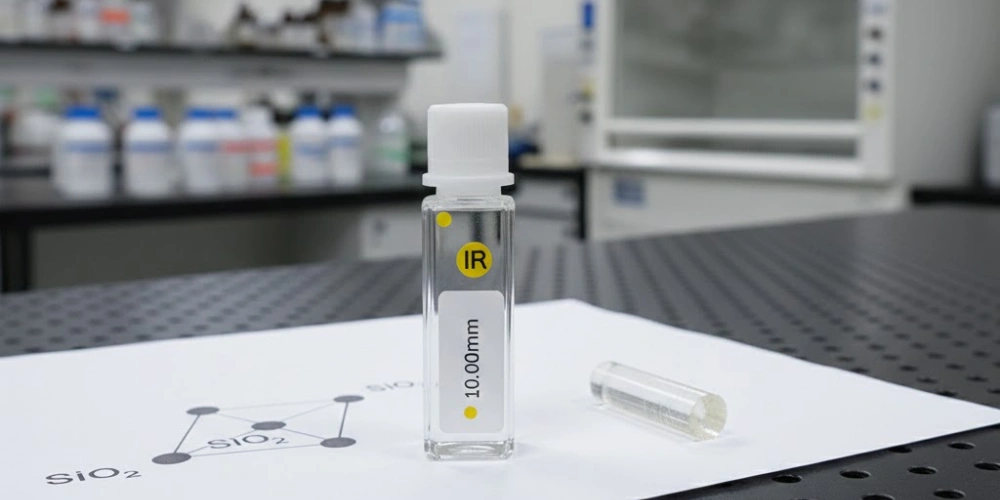
The Molecular Structure of Fused Silica Dictating Its Infrared Behavior
Rooted in the periodic arrangement of silicon and oxygen atoms, the optical behavior of fused silica is inseparable from its covalent network architecture. Before any vibrational frequency or absorbance value can be meaningfully interpreted, the structural foundation that generates those properties must be established with precision.
The Three-Dimensional Si-O-Si Network at the Atomic Scale
Fused silica is constructed from SiO₄ tetrahedra, each silicon atom covalently bonded to four oxygen atoms at a Si-O bond length of approximately 1.62 Å. These tetrahedra share corner oxygen atoms, propagating a continuous three-dimensional network throughout the bulk material.
In crystalline quartz, the Si-O-Si bond angle is fixed at approximately 144°, producing a well-ordered helical lattice with long-range periodicity. Fused silica, by contrast, is amorphous: the Si-O-Si bond angle varies across a broad distribution of roughly 120° to 180°, with no translational symmetry extending beyond a few tetrahedral units. This structural disorder has a direct and measurable consequence for infrared spectroscopy — absorption peaks in fused silica are significantly broader than those in crystalline quartz, a phenomenon known as inhomogeneous broadening, where each slightly different bond angle contributes a slightly shifted resonance frequency, and the ensemble of all angles produces a wide, featureless absorption envelope rather than sharp discrete lines.
Despite this structural difference, the chemical composition of both forms remains identically SiO₂. Consequently, their infrared absorption characteristics are governed by the same Si-O bond vibrations, and the mid-IR opacity observed in fused silica cuvettes is equally present in cuvettes fabricated from crystalline quartz.
Si-O Bond Polarity and the Origin of Infrared Activity
The electronegativity of oxygen is 3.44 on the Pauling scale, while that of silicon is 1.90, yielding an electronegativity difference of 1.54. This gap places the Si-O bond firmly in the category of strongly polar covalent bonds, generating a substantial permanent electric dipole moment along each Si-O vector.
Infrared absorption requires that a molecular vibration produce a change in the electric dipole moment during the oscillation cycle. For a vibration to be IR-active, the dipole moment must either increase or decrease as the bond stretches, bends, or rocks. In the Si-O-Si unit, the asymmetric stretching mode displaces the bridging oxygen atom perpendicular to the Si-Si axis, generating the largest possible dipole moment change of any mode available in the structure. This asymmetric mode therefore couples most strongly with the oscillating electric field of infrared radiation, producing the dominant absorption feature that renders quartz opaque across the central mid-IR window.
Symmetric stretching of Si-O-Si, by contrast, would theoretically cancel the dipole contributions from each side — however, the non-linear geometry of the Si-O-Si bond angle (~144°) prevents perfect cancellation, leaving a residual IR-active component even in the nominally symmetric mode. The consequence is that virtually all vibrational modes in SiO₂ carry some degree of IR activity, a structural reality that makes quartz fundamentally incompatible with mid-IR transmission applications.
Structural Parameters of Fused Silica Relevant to IR Behavior
| 매개변수 | 가치 |
|---|---|
| Si-O Bond Length (Å) | ~1.62 |
| Si-O-Si Bond Angle — Crystalline Quartz (°) | ~144 (fixed) |
| Si-O-Si Bond Angle — Fused Silica (°) | 120–180 (distributed) |
| Si-O Bond Energy (kJ/mol) | ~444 |
| Electronegativity Difference (O vs Si) | 1.54 |
| Bulk Density (g/cm³) | ~2.20 |
| Electronic Bandgap (eV) | ~8.9 |
Si-O Vibrational Modes Driving Quartz Cuvette Mid-IR Absorption
The opacity of quartz in the mid-infrared is not a single-frequency event — it is the cumulative result of multiple vibrational modes distributed across the entire 400–4000 cm⁻¹ window. Each mode corresponds to a distinct atomic motion within the Si-O-Si framework, and each contributes its own absorption band with characteristic frequency, intensity, and width. Taken together, these bands leave no usable transmission gap across the standard FTIR scanning range, which is precisely why quartz cuvette IR transmission in the mid-IR produces results indistinguishable from a blocked beam.
The Dominant Asymmetric Stretching Band Centered near 1040–1100 cm⁻¹
The asymmetric Si-O-Si stretching vibration produces the most intense and spectrally broadest absorption feature in the entire mid-infrared profile of fused silica.
During this mode, the bridging oxygen atom moves along the direction connecting the two silicon atoms, but in a phase relationship that causes the two Si-O bonds to stretch and compress simultaneously rather than in unison. This motion generates the maximum possible change in electric dipole moment per unit displacement, coupling with extraordinary efficiency to the electromagnetic field of infrared radiation. The resulting absorption band is centered between 1040 and 1100 cm⁻¹ and exhibits a full width at half maximum (FWHM) of 150–200 cm⁻¹ — a breadth directly attributable to the inhomogeneous bond angle distribution in amorphous fused silica. In a typical FTIR measurement, absorbance values across this band exceed 4 AU (corresponding to a transmittance below 0.01%) for a standard 1 mm path length through quartz.
The spectral position of this band is particularly damaging to analytical utility. The 900–1200 cm⁻¹ region encompasses critical fingerprint absorptions for organic molecules: C-O single-bond stretching (~1000–1100 cm⁻¹), C-O-C ether stretching (~1060–1150 cm⁻¹), and C-C skeletal vibrations in numerous functional classes. Any attempt to measure these features through a quartz cuvette produces a completely saturated baseline in which the sample signal is wholly buried beneath the quartz absorption, rendering quantitative analysis impossible regardless of sample concentration or instrument sensitivity.
The Symmetric Bending Band near 800 cm⁻¹ and Its Spectral Consequences
A secondary but analytically significant absorption band appears near 800 cm⁻¹, arising from the symmetric bending (or "breathing") motion of the Si-O-Si angle.
In this mode, both Si-O bonds compress and extend symmetrically while the Si-O-Si angle oscillates. Although the dipole moment change per cycle is smaller than that of the asymmetric stretching mode, the band still achieves 30–50% of the peak absorbance intensity of the dominant 1100 cm⁻¹ feature — placing absorbance values in the range of 1.5–2.5 AU for a 1 mm quartz path. This exceeds the practical dynamic range of most FTIR instruments, which begin to lose linear response above approximately 3 AU and experience severe signal-to-noise degradation above 2 AU.
The frequency region around 750–850 cm⁻¹ is analytically important for aromatic systems: out-of-plane C-H bending modes in mono- and disubstituted benzene rings appear in this window, as do C-Cl stretching vibrations (~700–800 cm⁻¹) and C-S stretching (~600–700 cm⁻¹). The combined effect of the 800 cm⁻¹ bending band and the 1100 cm⁻¹ stretching band means that the spectral range from approximately 750 to 1200 cm⁻¹ is effectively inaccessible when using quartz as a window or cuvette material — a continuous dead zone spanning 450 wavenumbers at the heart of the organic fingerprint region.
Rocking and Twisting Modes below 500 cm⁻¹ Extending into the Far-IR
Below 500 cm⁻¹, fused silica exhibits additional absorption arising from collective rocking and twisting motions of Si-O-Si linkages within the network.
The rocking mode near 460 cm⁻¹ involves coupled displacement of multiple oxygen atoms in a direction perpendicular to the Si-Si axis, creating a lower-frequency IR-active mode with moderate intensity. This band places an absorption feature at the very low-wavenumber boundary of standard FTIR instruments, which typically scan down to 400 cm⁻¹ using KBr beamsplitters and DTGS detectors. Instruments equipped with far-IR capabilities extending below 400 cm⁻¹ will encounter further absorption from lattice twisting modes, but even within the standard 400–600 cm⁻¹ range, the quartz rocking band imposes a non-trivial baseline distortion.
When the absorption contributions from all three vibrational regions are mapped together — asymmetric stretching (~1040–1100 cm⁻¹), symmetric bending (~800 cm⁻¹), and rocking (~460 cm⁻¹) — the resulting absorption profile covers the mid-IR range with no transmission gap wide enough to support quantitative spectroscopic work. The region between 600 and 900 cm⁻¹ offers the weakest absorption of the three zones, but absorbance values there still consistently exceed 0.5–1.0 AU for standard cuvette wall thicknesses, which remains too high for reliable background subtraction.
Quantifying Absorption Intensity via Molar Absorptivity and Path Length
Applying 비어-램버트1 logic to a solid optical material requires a reframing of the standard equation, since fused silica has no solution concentration — instead, absorption is characterized per unit thickness.
For a standard quartz cuvette window of 1 mm thickness, the absorbance at 1100 cm⁻¹ routinely exceeds 4 AU, as established by ellipsometric and FTIR transmission measurements on reference-grade fused silica plates. At 4 AU, transmittance equals 10⁻⁴, meaning that for every 10,000 photons entering the cuvette wall at that frequency, fewer than 1 exits. The signal reaching the detector is indistinguishable from detector dark noise, producing a flat, meaningless baseline rather than a resolvable absorption spectrum of the sample contained within.
A logical engineering response might be to reduce the quartz wall thickness to minimize absorption. In practice, reducing wall thickness to 0.2 mm — the thinnest value achievable in precision optical fabrication without compromising structural integrity — still produces an absorbance of approximately 0.8 AU at 1100 cm⁻¹ on each face. Since infrared light must pass through two opposing walls to traverse the cuvette, the total quartz contribution reaches ~1.6 AU before the beam has interacted with any sample. This exceeds the practical background subtraction limit, leaving insufficient dynamic range for the instrument to resolve sample absorption features on top of the residual quartz signal. The path-length reduction strategy, therefore, addresses symptom rather than cause — the intrinsic molar absorptivity of the Si-O bond cannot be reduced by thinning the walls.
Quartz Absorption Bands across the Mid-IR Spectral Range
| Vibrational Mode | Frequency (cm⁻¹) | 파장(μm) | Relative Intensity | Analytical Region Affected |
|---|---|---|---|---|
| Asymmetric Si-O-Si Stretching | 1040–1100 | 9.1–9.6 | Very Strong (>4 AU/mm) | C-O, C-O-C fingerprint region |
| Symmetric Si-O-Si Bending | ~800 | ~12.5 | Strong (1.5–2.5 AU/mm) | Aromatic C-H, C-Cl stretching |
| Si-O-Si Rocking | ~460 | ~21.7 | Moderate (0.5–1.0 AU/mm) | Low-wavenumber fingerprint |
| Combination / Overtone Bands | 1600–2000 | 5.0–6.25 | Weak | Minor baseline contribution |
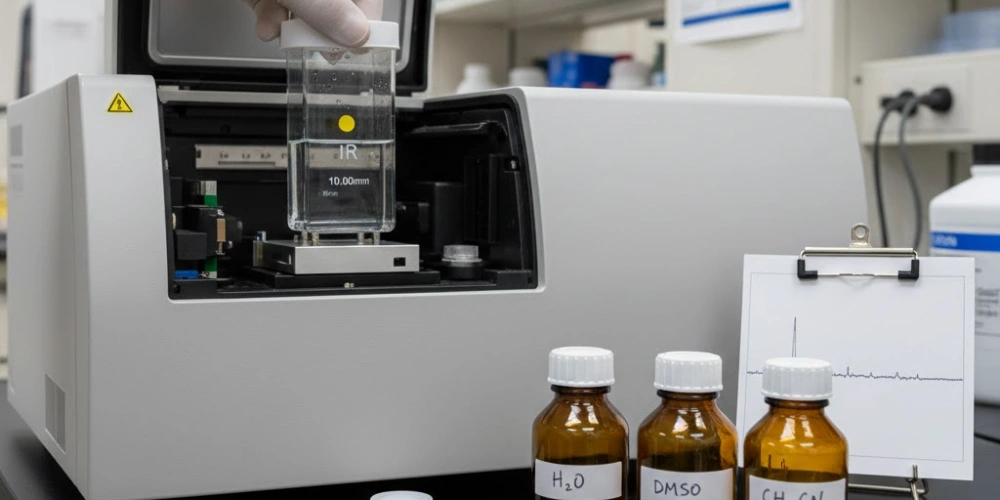
The Full Transmission Profile for Quartz across UV, NIR and Mid-IR Wavelengths
Placing the mid-IR opacity in its broader spectral context reveals why quartz enjoys such widespread adoption in UV-Vis spectroscopy while failing categorically in FTIR applications. The transmission behavior of fused silica spans a range of over two orders of magnitude in wavelength, and the boundaries between its usable and unusable regions are governed by entirely different physical mechanisms at each end of the spectrum.
UV-Visible Transparency from 190 nm Driven by the Wide Electronic Bandgap
The transparency of fused silica in the ultraviolet and visible spectral regions is a direct consequence of its exceptionally wide electronic bandgap.
The bandgap of SiO₂ is approximately 8.9 eV, corresponding to a photon wavelength of about 140 nm in the vacuum ultraviolet. Photons with energies below this threshold — which includes the entire UV, visible, and near-infrared spectrum — cannot promote electrons from the valence band to the conduction band, eliminating electronic absorption as a loss mechanism. High-purity UV-grade fused silica achieves transmittance values exceeding 90% across the 190–400 nm range for a 10 mm path length, making it the standard window material for UV absorbance measurements of proteins (~280 nm), nucleic acids (~260 nm), and aromatic chromophores (~250–300 nm).
The practical UV cutoff at approximately 190 nm for standard fused silica is imposed not by the bandgap itself but by trace impurities and surface contamination. Ultra-pure grades, sometimes designated as "UV-grade" or "deep UV" fused silica with controlled OH content, extend usable transmission to approximately 160 nm. This distinction is analytically relevant for synchrotron-based measurements and deep-UV Raman spectroscopy, where even minor absorption at sub-200 nm wavelengths can distort quantitative results.
Near-Infrared Usability between 700 nm and Approximately 2500 nm
The near-infrared region represents the secondary transmission window of fused silica, one that is frequently underappreciated in the context of quartz cuvette selection.
Between 700 nm and approximately 2500 nm (corresponding to 14,285–4,000 cm⁻¹), fused silica maintains transmittance values typically in the range of 80-92% for a 10 mm path length in high-quality material, with losses attributable primarily to surface reflection (~4% per interface, governed by the Fresnel equations2 at a refractive index of ~1.45) rather than bulk absorption. Within this window, two minor absorption features are detectable in high-sensitivity measurements: a Si-OH combination band near 1380 nm (~7,246 cm⁻¹) and a weaker overtone feature near 2200 nm (~4,545 cm⁻¹). Both arise from hydroxyl groups incorporated into the silica network during synthesis, and their intensities depend strongly on the OH content of the specific fused silica grade used.
These overtone features are weak enough — typically below 0.05 AU for standard path lengths — that they do not interfere with the majority of NIR analytical applications, including near-infrared protein quantification, moisture content determination in pharmaceutical powders, and NIR chemometric calibrations for food analysis. The quartz cuvette IR transmission in the NIR regime is therefore robust and reliable, which explains why quartz remains the cuvette material of choice for spectrophotometers operating in the 300–2500 nm range.
The Onset of Mid-IR Opacity Starting from 2500 nm (4000 cm⁻¹) Onward
The transition from near-infrared transparency to mid-infrared opacity in fused silica is not a sharp boundary but a progressive deterioration that accelerates rapidly once the Si-O bond fundamentals begin contributing.
At 2500 nm (4000 cm⁻¹), transmittance for a 1 mm fused silica path has already declined to approximately 70%, reflecting the onset of Si-O stretching overtone absorption in the 4000–3500 cm⁻¹ region. By 2700 nm (~3704 cm⁻¹), transmittance falls below 10%, driven by a combination of Si-OH stretching fundamentals (~3670 cm⁻¹) and Si-O network overtones. At 3500 nm (~2857 cm⁻¹), transmittance is effectively below 1%, placing this wavelength beyond any practical use for transmission measurements. Beyond 4000 nm (2500 cm⁻¹), absorbance values exceed 4 AU continuously across the entire mid-IR range, with no recovery until the far-infrared below ~400 cm⁻¹.
The practical implication for FTIR spectroscopy is unambiguous: the standard FTIR scanning range of 400–4000 cm⁻¹ aligns almost perfectly with the absorption-dominated region of fused silica. There is no sub-range within standard FTIR operation where quartz delivers acceptable transmission for sample characterization. Instruments that begin their scan at 4000 cm⁻¹ encounter a degrading quartz signal immediately, and by 3000 cm⁻¹ the measurement is already compromised beyond recovery.
Transmission Performance of Fused Silica across Spectral Regions
| 스펙트럼 영역 | 파장 범위 | Wavenumber Range (cm⁻¹) | Typical Transmittance (1 mm path) | Usable for Spectroscopy |
|---|---|---|---|---|
| Vacuum UV | <190 nm | >52,630 | <10% | No (standard grades) |
| UV | 190–400 nm | 25,000–52,630 | >90% | 예 |
| 가시성 | 400–700 nm | 14,285–25,000 | >92% | 예 |
| 근적외선 | 700–2500 nm | 4,000–14,285 | 80-92% | 예 |
| NIR-MIR Transition | 2500–3500 nm | 2,857–4,000 | 1–70% (declining) | No (unreliable) |
| Mid-IR | 3500–25,000 nm | 400–2,857 | <1% | 아니요 |
Phonon Dynamics in Quartz Reinforcing IR Opacity at Characteristic Frequencies
Beyond the molecular bond vibration picture, a solid-state physics framework offers a complementary and deeper explanation for why quartz cuvette IR transmission collapses so completely in the mid-infrared. The concept of phonons — quantized lattice vibrations — and their interaction with electromagnetic radiation reveals that the opacity of fused silica is not merely a chemical bond phenomenon but a collective material response that includes anomalous reflectance in addition to absorption.
Transverse Optical Phonons and Their Coupling with Infrared Radiation
In condensed-matter physics, lattice vibrations are classified by their dispersion relationship into acoustic branches (where adjacent atoms move in phase) and optical branches (where adjacent atoms move out of phase).
Optical phonons in ionic or polar-covalent materials carry oscillating electric dipole moments, making them capable of coupling directly with the electric field of infrared photons. In SiO₂, the transverse optical (TO) phonon branches — where atomic displacements are perpendicular to the phonon propagation direction — produce resonant coupling with infrared radiation at three primary frequencies: ~1075 cm⁻¹, ~800 cm⁻¹, and ~460 cm⁻¹. These frequencies correspond precisely to the Si-O asymmetric stretching, symmetric bending, and rocking modes described in the molecular picture, confirming that both frameworks describe the same physical phenomenon at different levels of abstraction.
When infrared photons at these frequencies enter fused silica, they couple with the TO phonons to form phonon-polaritons3 — hybrid quasiparticles that have a mixed photonic-phononic character. Within the polariton formation range, the group velocity of light in the material drops dramatically, energy is efficiently transferred to lattice vibrations, and the material's optical response transitions from transparent to opaque over a narrow frequency band. This phonon-polariton coupling mechanism is why the absorption bands in fused silica are so intense relative to typical molecular chromophores — the entire lattice participates collectively in the absorption event, not merely individual bonds in isolation.
The Reststrahlen Bands and Anomalous Reflectance in the Mid-IR
Between the transverse optical (TO) and longitudinal optical (LO) phonon frequencies, fused silica enters a regime of anomalous optical response known as the Reststrahlen effect — a term derived from the German for "residual rays," describing the high-reflectance bands discovered in early infrared studies of ionic crystals.
In this frequency range, the real part of the dielectric function ε₁ becomes negative, which means the refractive index acquires a predominantly imaginary character and the material behaves more like a metal than a dielectric with respect to electromagnetic radiation. Light incident on a fused silica surface within the Reststrahlen bands — approximately 820–1250 cm⁻¹ — is reflected with efficiency reaching 80–90% rather than transmitted or absorbed in the conventional sense. The transmitted fraction is negligible, but the physical mechanism is reflectance-dominated rather than absorption-dominated, producing a qualitatively different distortion in FTIR spectra.
In practice, when a quartz cuvette is measured in an FTIR spectrometer, the spectral region spanning the Reststrahlen bands produces a characteristic "dispersive" or "anomalous" line shape — a derivative-like signal with a positive lobe on the high-frequency side and a negative excursion (below baseline) on the low-frequency side — rather than a simple broad absorption plateau. Analysts encountering this signature for the first time frequently misattribute it to instrument malfunction, detector saturation, or incorrect background collection. In reality, the dispersive line shape between approximately 820 and 1250 cm⁻¹ is a diagnostic fingerprint for Reststrahlen reflection from a quartz or fused silica optical element in the beam path. Recognizing this signature is directly useful for troubleshooting IR spectroscopy setups where the identity of interfering optical components may not be immediately obvious.
Phonon Frequencies and Optical Response in Fused Silica
| Phonon Mode | TO Frequency (cm⁻¹) | LO Frequency (cm⁻¹) | Reststrahlen Range (cm⁻¹) | Dominant Optical Effect |
|---|---|---|---|---|
| Asymmetric Stretching | ~1075 | ~1250 | 1075–1250 | High reflectance + absorption |
| Symmetric Bending | ~800 | ~820 | 800–820 | Absorption dominant |
| Si-O Rocking | ~460 | ~510 | 460–510 | Absorption dominant |
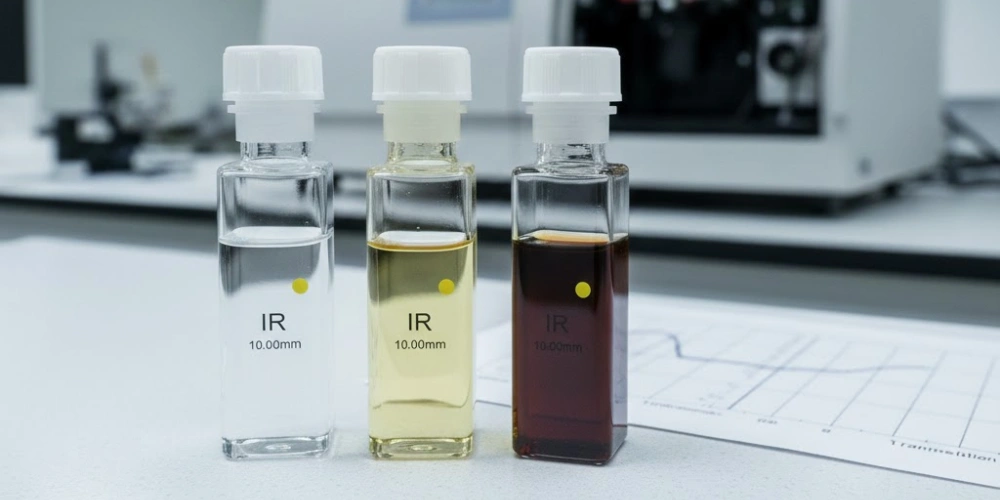
Compounding Opacity from Solvent and Sample IR Absorption in Quartz Cuvettes
Even setting aside the intrinsic limitations of quartz, the full picture of why mid-IR measurements fail in a quartz cuvette must account for the additional absorption contributed by the sample medium itself. In nearly all practical IR spectroscopy scenarios, the analyte is dissolved in a solvent — and the Beer-Lambert principle dictates that absorbances from quartz walls, solvent, and sample add linearly: A_total = A_quartz + A_solvent + A_sample.
-
물 is the most commonly used solvent in biochemical and pharmaceutical IR work, and its absorption profile overlaps severely with the quartz opacity window. The broad O-H stretching band of liquid water spans 3200–3600 cm⁻¹ (~2.8–3.1 μm), coinciding precisely with the region where quartz transmittance is already declining sharply below 10%. The O-H bending fundamental at ~1640 cm⁻¹ falls within a region where quartz offers no useful transmission, and the water combination band near ~2125 cm⁻¹ adds further absorbance in the 5 μm range. A 100 μm path length of pure water alone contributes approximately 1.0–1.5 AU at 3400 cm⁻¹, which when added to the quartz wall contribution produces a total absorbance well above the instrument's functional ceiling.
-
Dimethyl sulfoxide (DMSO), frequently used as a vehicle for hydrophobic pharmaceutical compounds, exhibits a strong S=O stretching absorption at ~1045 cm⁻¹ — positioned directly within the dominant quartz absorption band at 1040–1100 cm⁻¹. The combined absorbance of quartz plus DMSO at this frequency makes the region around 1000–1100 cm⁻¹ completely inaccessible regardless of path length. 아세토니트릴, another common organic solvent, displays a C≡N stretching band near 2250 cm⁻¹ (~4.4 μm), a region where quartz transmittance has already fallen to near zero, further compounding signal loss at that frequency. Chloroform offers a relatively cleaner mid-IR window between approximately 700 and 1200 cm⁻¹ compared to other common solvents, but this advantage is irrelevant when the cuvette walls themselves saturate the detector in exactly that region.
-
Thinning the cuvette walls is sometimes proposed as a mitigation strategy, but this approach fails to resolve the fundamental constraint. A standard fused silica cuvette with 1.25 mm wall thickness contributes approximately 5 AU at 1100 cm⁻¹. Reducing wall thickness to the fabrication minimum of ~0.2 mm per face (total ~0.4 mm of quartz in the beam) still delivers approximately 1.6 AU at the same frequency — entirely from the cuvette material, before any sample or solvent absorption is added. Since the instrument's background subtraction algorithm cannot reliably correct for a reference absorbance this high, the residual signal-to-noise ratio in the sample spectrum is insufficient for any quantitative analysis, rendering the path-length reduction approach ineffective as a practical solution for mid-IR work in quartz.
A natural transition from recognizing the compounding absorption problem is to ask what optical materials can actually serve the mid-IR range — and why their physical compositions yield fundamentally different transmission behavior.
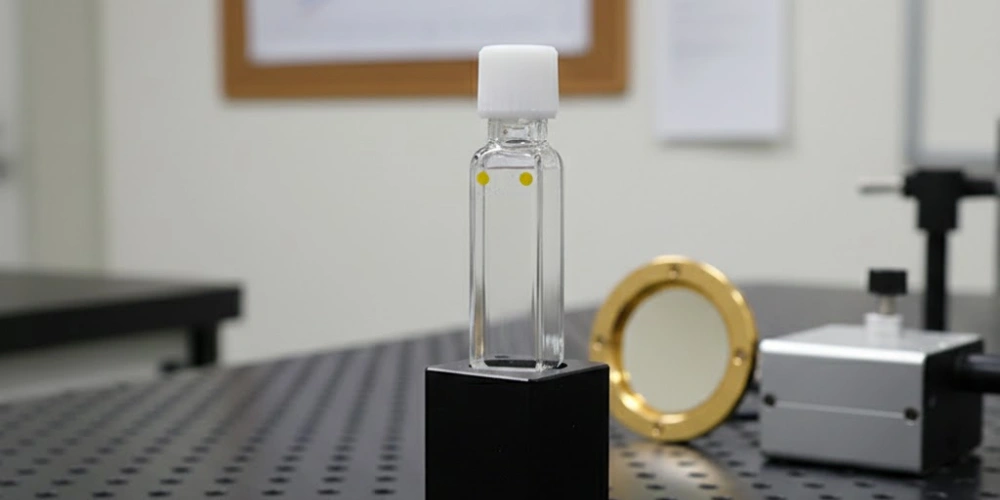
IR-Transparent Window Materials with Transmission beyond Quartz Limitations
The inability of quartz to transmit mid-infrared radiation is not an artifact of purity, surface quality, or fabrication — it is a direct consequence of the mass of silicon and oxygen atoms and the force constants of the Si-O bond. Understanding why alternative materials succeed in the mid-IR requires a brief excursion into the physics of lattice vibration cutoff frequencies.
The classical model for a diatomic oscillator gives the vibrational frequency as ν ∝ √(k/μ), where k is the force constant (bond stiffness) and μ is the reduced mass of the oscillating pair. For the Si-O pair, the reduced mass μ = (28 × 16)/(28 + 16) ≈ 10.2 amu. Substituting heavier atoms — calcium (40 amu), barium (137 amu), or zinc (65 amu) — dramatically increases μ, driving ν to lower frequencies and shifting the phonon cutoff far into the long-wavelength infrared. This is precisely why CaF₂, BaF₂, and ZnSe outperform quartz in mid-IR applications: their lattice vibrations simply resonate at frequencies well below the analytical window, leaving the 400–4000 cm⁻¹ range free of intrinsic absorption.
-
Calcium Fluoride (CaF₂) transmits from approximately 130 nm to 8 μm (1250 cm⁻¹), covering the entire UV-Vis-NIR and lower mid-IR range. Its Ca-F phonon cutoff near ~1250 cm⁻¹ leaves the upper fingerprint region accessible. CaF₂ is water-insoluble and mechanically robust, making it widely applicable to aqueous sample measurements up to 8 μm.
-
Barium Fluoride (BaF₂) extends transmission to approximately 12 μm (833 cm⁻¹), with the heavier barium atom pushing the phonon cutoff to lower wavenumbers. Transmittance in the UV starts near 150 nm, providing an exceptionally broad spectral range. BaF₂ is slightly more susceptible to moisture than CaF₂ but remains practical for most laboratory conditions with proper handling.
-
Zinc Selenide (ZnSe) offers transmission from approximately 0.6 to 20 μm (500 cm⁻¹), making it one of the broadest mid-IR window materials available. Its high refractive index (~2.4) results in significant Fresnel reflection losses (~17% per surface) without anti-reflection coatings, but its durability and chemical inertness make it the default choice for ATR crystal applications and mid-IR cuvette windows in demanding environments.
-
Potassium Bromide (KBr) transmits from approximately 0.25 to 25 μm (400 cm⁻¹), covering the complete standard FTIR range. Its K-Br phonon cutoff lies below 400 cm⁻¹, leaving the entire fingerprint region fully accessible. The critical limitation is water solubility — KBr windows dissolve rapidly in aqueous environments and must be restricted to dry, non-hygroscopic samples.
-
Sodium Chloride (NaCl) spans approximately 0.25 to 15 μm (667 cm⁻¹) and was historically the standard IR window material before KBr became preferred. Like KBr, it is water-soluble and must be protected from humid atmospheres.
-
Germanium (Ge) transmits from approximately 2 to 16 μm (625 cm⁻¹) and is opaque in the UV and visible, making it specific to mid-IR applications. Its high refractive index (~4.0) requires anti-reflection coating for efficient use, but its extreme hardness and chemical resistance make it the preferred ATR crystal for surface analysis.
None of these superior mid-IR transmission characteristics can be replicated in quartz through any modification of synthesis, polishing, or coating, because the fundamental limitation is the atomic mass of silicon (28 amu) and the Si-O force constant — parameters that are intrinsic to the chemical identity of SiO₂ and immutable by post-fabrication treatment.
Optical Window Materials for IR Spectroscopy
| 재료 | 전송 범위 | Wavenumber Range (cm⁻¹) | Reduced Mass of Ion Pair (amu) | Water Solubility | 주요 한계 |
|---|---|---|---|---|---|
| 용융 실리카(SiO₂) | 0.19–2.5 μm | 4,000–52,630 | ~10.2 (Si-O) | 불용성 | Opaque across standard FTIR range |
| CaF₂ | 0.13–8 μm | 1,250–76,920 | ~13.7 (Ca-F) | 불용성 | Cutoff at 1250 cm⁻¹ |
| BaF₂ | 0.15–12 μm | 833–66,670 | ~22.3 (Ba-F) | Slightly soluble | Moisture sensitivity |
| ZnSe | 0.6–20 μm | 500–16,670 | ~31.3 (Zn-Se) | 불용성 | High Fresnel loss (~17%/surface) |
| KBr | 0.25–25 μm | 400–40,000 | ~43.5 (K-Br) | Highly soluble | Aqueous incompatibility |
| NaCl | 0.25–15 μm | 667–40,000 | ~20.0 (Na-Cl) | Highly soluble | Aqueous incompatibility |
| Germanium | 2–16 μm | 625–5,000 | ~39.0 (Ge-Ge) | 불용성 | Opaque in UV-Vis |
Frequently Asked Questions about Quartz Cuvette IR Transparency
Practitioners working at the intersection of UV-Vis and infrared spectroscopy frequently encounter the same set of questions when quartz cuvette IR transmission behavior first reveals itself in experimental results. The answers below address the most common points of confusion with specific numerical values and mechanistic clarity.
Q1: Does quartz transmit any infrared light at all?
Fused silica transmits infrared radiation effectively within the near-infrared range of 700–2500 nm (4,000–14,285 cm⁻¹), achieving transmittance values of 80–92% across this window for standard path lengths. However, beyond 2500 nm — encompassing the entire mid-infrared range from 2500 nm to 25 μm (400–4000 cm⁻¹) — quartz becomes progressively and then completely opaque due to the onset of Si-O bond fundamental absorption. The frequently encountered assumption that quartz is a universal infrared material conflates its near-IR transparency with the mid-IR region, where its behavior is categorically different. A useful rule of thumb: if the spectroscopic application involves wavelengths beyond 2.5 μm, quartz is not a viable window material.
Q2: What is the exact transmission range of a quartz cuvette in both nm and cm⁻¹?
The usable transmission range of standard fused silica cuvettes extends from approximately 190 nm (52,630 cm⁻¹) at the UV end to approximately 2500 nm (4,000 cm⁻¹) at the near-IR boundary. Transmittance remains above 80% throughout the 190–2500 nm window for a 10 mm path length in high-quality material, with the exception of minor OH overtone features near 1380 nm and 2200 nm. Above 2500 nm, transmittance declines steeply — reaching below 10% by 2700 nm (~3704 cm⁻¹) and below 1% by 3500 nm (~2857 cm⁻¹). The mid-IR cutoff is therefore best described not as a single wavelength but as a rapid-transition zone spanning approximately 2500–3500 nm, after which the material is fully opaque across the remaining mid-IR range.
Q3: Can a quartz cuvette be used for FTIR measurements?
No. The standard FTIR scanning range of 400–4000 cm⁻¹ maps directly onto the region where fused silica absorbs most intensely, with absorbance values exceeding 4 AU at the dominant 1040–1100 cm⁻¹ band. FTIR measurements attempted through quartz walls produce a detector signal at or below the noise floor across the majority of the analytical window, generating spectra that appear as featureless noise or a flat saturated baseline. For FTIR liquid-cell applications, calcium fluoride (CaF₂) windows are appropriate for aqueous or moderately polar solvent systems up to 8 μm, while barium fluoride (BaF₂) extends coverage to 12 μm, and zinc selenide (ZnSe) or potassium bromide (KBr) cells accommodate the broadest mid-IR range for non-aqueous samples.
Q4: Is fused silica the same as quartz for IR transmission purposes?
Both fused silica and crystalline quartz are chemically SiO₂, and their mid-infrared absorption behavior is governed by the same Si-O bond vibrations at essentially the same frequencies (~460 cm⁻¹, ~800 cm⁻¹, ~1075 cm⁻¹). For mid-IR transmission purposes, they are functionally identical — both are opaque across the standard FTIR range. The primary difference lies at the UV end: UV-grade fused silica can transmit down to approximately 160 nm, while crystalline quartz typically transmits to about 180 nm, due to differences in defect density and OH content in the amorphous vs. crystalline forms. In NIR and mid-IR contexts, this UV distinction is irrelevant, and the two materials can be treated interchangeably with respect to their IR opacity.
Q5: Why does an FTIR spectrum show a completely flat baseline when using a quartz sample holder?
A flat or featureless FTIR baseline obtained with a quartz cuvette or window in the beam path is the expected instrument response to a detector signal reduced to noise-floor level by quartz absorption. At the dominant Si-O stretching frequencies (1040–1100 cm⁻¹), absorbance exceeds 4 AU for even modest quartz thicknesses, meaning fewer than 0.01% of photons at those frequencies survive transmission through the material. The instrument's analog-to-digital converter receives values effectively equal to zero (no-light condition), and after ratioing against the background spectrum — which itself was collected without the quartz in the beam, or with a different configuration — the resulting transmittance calculation produces division-by-near-zero artifacts that manifest as a flat, noise-dominated trace. This signature is distinct from a saturated absorption peak, which shows a rounded maximum; the quartz response typically produces a completely level plateau across the entire 800–1250 cm⁻¹ Reststrahlen region.
Q6: At what wavenumber does quartz become opaque to infrared radiation?
The onset of significant opacity begins at approximately 4000 cm⁻¹ (2500 nm), where transmittance for a 1 mm path has declined to roughly 70%. By 3700 cm⁻¹ (2702 nm), transmittance falls below 10%, and by 2857 cm⁻¹ (3500 nm) it is below 1%. The material is therefore effectively opaque to practical spectroscopy across the entire range below approximately 3500 cm⁻¹, and completely opaque — with absorbance exceeding instrument dynamic range — for wavenumbers below 2500 cm⁻¹. Given that the FTIR fingerprint region (600–1500 cm⁻¹) lies entirely within the zone of maximum quartz absorption, the material offers no sub-range within standard mid-IR spectroscopy where transmission-mode measurements through quartz walls can yield reliable analytical data.
결론
The mid-IR opacity of quartz cuvettes originates at the atomic level and propagates through every scale of physical description. The Si-O bond's high polarity generates intense IR-active vibrations at ~460, ~800, and ~1040–1100 cm⁻¹. These fundamentals, amplified by the high density of the SiO₂ network and the collective phonon-polariton coupling mechanism, produce absorbance values exceeding 4 AU per millimeter across the heart of the standard FTIR scanning range. The Reststrahlen effect further distorts measurements with anomalous reflectance between ~820 and 1250 cm⁻¹. Solvent contributions compound the problem additively. No amount of wall-thickness reduction resolves the underlying constraint, because the Si-O bond mass and force constant — the root cause — are immutable properties of silicon dioxide chemistry. For any spectroscopic application requiring mid-IR transmission, window materials with heavier constituent atoms and lower-frequency phonon cutoffs are the only physically valid solution.
참조:
-
The Beer-Lambert law framework used to quantify absorbance per unit path length in fused silica is thoroughly covered in Wikipedia's dedicated entry on the law's derivation and limitations. ↩
-
The Fresnel equations governing surface reflection losses at each quartz-air interface — approximately 4% per surface at a refractive index of ~1.45. ↩
-
The phonon-polariton quasiparticles formed when infrared photons couple with transverse optical phonons in SiO₂ — producing the dramatic opacity observed across the mid-IR ↩